Olympic Medals Data Visualization
The assignment data was extracted from the Wikipedia entry on All Time Olympic Games Medals , with some minor modification to make things interesting. The dataset is split into two CSV files one of summer games and the other for the winter games and combined total. Here you can find the datasets: Summer Games and Winter Games . Use the datasets to answer the following questions:
Question 1: (based on the both datasets)
Merge the two datasets Olympics_dataset1.csv and Olympics_dataset2.csv (do not concatenate the datasets and ignore the first row of each of the datasets). And rename columns of the result dataframe as follow (remove the rest of columns from the result dataset):
Country, summer_rubbish, summer_participation, summer_gold, summer_silver, summer_bronze, summer_total, winter_ participation , winter_gold, winter_silver, winter_bronze, winter_total
Remove the “Totals” row from the dataframe Display the first five rows of the dataframe
--------------- question_1 ---------------
                    Country summer_rubbish summer_participation summer_gold summer_silver summer_bronze summer_total winter_participation winter_gold winter_silver winter_bronze winter_total
1         Afghanistan (AFG)            BLA                   14           0             0             2            2                    0           0             0             0            0
2             Algeria (ALG)            BLA                   13           5             4             8           17                    3           0             0             0            0
3           Argentina (ARG)            BLA                   24          21            25            28           74                   19           0             0             0            0
4             Armenia (ARM)            BLA                    6           2             6             6           14                    7           0             0             0            0
5   Australasia (ANZ) [ANZ]            BLA                    2           3             4             5           12                    0           0             0             0            0
Question 2: (based on the dataframe created in Question-1)
Rename country to only keep the name of the country without the abbreviations (Afghanistan (AFG) –> Afghanistan) . Set the index as the country name, remove below columns and then display the first 5 rows in the Dataframe :
summer_rubbish, summer_total , winter _total
--------------- question_2 ---------------
              summer_participation summer_gold summer_silver summer_bronze winter_participation winter_gold winter_silver winter_bronze
Country
 Afghanistan                    14           0             0             2                    0           0             0             0
 Algeria                        13           5             4             8                    3           0             0             0
 Argentina                      24          21            25            28                   19           0             0             0
 Armenia                         6           2             6             6                    7           0             0             0
 Australasia                     2           3             4             5                    0           0             0             0
Question 3: (based on the dataframe created in Question-2)
Remove the rows with NaN fields and display the last 10 rows .
--------------- question_3 ---------------
                                   summer_participation summer_gold summer_silver summer_bronze winter_participation winter_gold winter_silver winter_bronze
Country
 Vietnam                                             15           1             3             0                    0           0             0             0
 Virgin Islands                                      12           0             1             0                    7           0             0             0
 Yugoslavia                                          18          28            31            31                   16           0             3             1
 Zambia                                              13           0             1             1                    0           0             0             0
 Zimbabwe                                            13           3             4             1                    1           0             0             0
 Unified Team                                         1          45            38            29                    1           9             6             8
 Independent Olympic Athletes                         3           1             0             1                    0           0             0             0
 Independent Olympic Participants                     1           0             1             2                    0           0             0             0
 Olympic Athletes from Russia                         0           0             0             0                    1           2             6             9
 Mixed team                                           3           8             5             4                    0           0             0             0
Question 4: (based on the dataframe created in Question-3)
Calculate and display which country has won the most gold medals in summer games? (Just print the country name)
--------------- question_4 ---------------
 United States
Question 5 : (based on the dataframe created in Question-3)
Calculate and display which country name had the biggest difference between their summer and winter gold medal? (Just print the country name and the difference)
--------------- question_5 ---------------
 United States  917
Question 6: (based on the dataframe created in Question-3)
Sort the countries in descending order, according to the number of total of medals (summer and winter) and display the first and last 5 rows of the dataframe (including a column showing the total number of medals) .
--------------- question_6 ---------------
                summer_participation  summer_gold  summer_silver  summer_bronze winter_participation  winter_gold  winter_silver  winter_bronze  total
Country
 United States                    27         1022            795            705                   23          105            110             90   2827
 Soviet Union                      9          395            319            296                    9           78             57             59   1204
 Great Britain                    28          263            295            291                   23           11              4             16    880
 Germany                          16          191            194            230                   12           92             88             60    855
 France                           28          212            241            263                   23           36             35             53    840
           summer_participation  summer_gold  summer_silver  summer_bronze winter_participation  winter_gold  winter_silver  winter_bronze  total
Country
 Jordan                      10            1              0              0                    0            0              0              0      1
 Djibouti                     8            0              0              1                    0            0              0              0      1
 Cyprus                      10            0              1              0                   11            0              0              0      1
 Sudan                       12            0              1              0                    0            0              0              0      1
 Senegal                     14            0              1              0                    5            0              0              0      1
Question 7: (based on the dataframe created in Question-3)
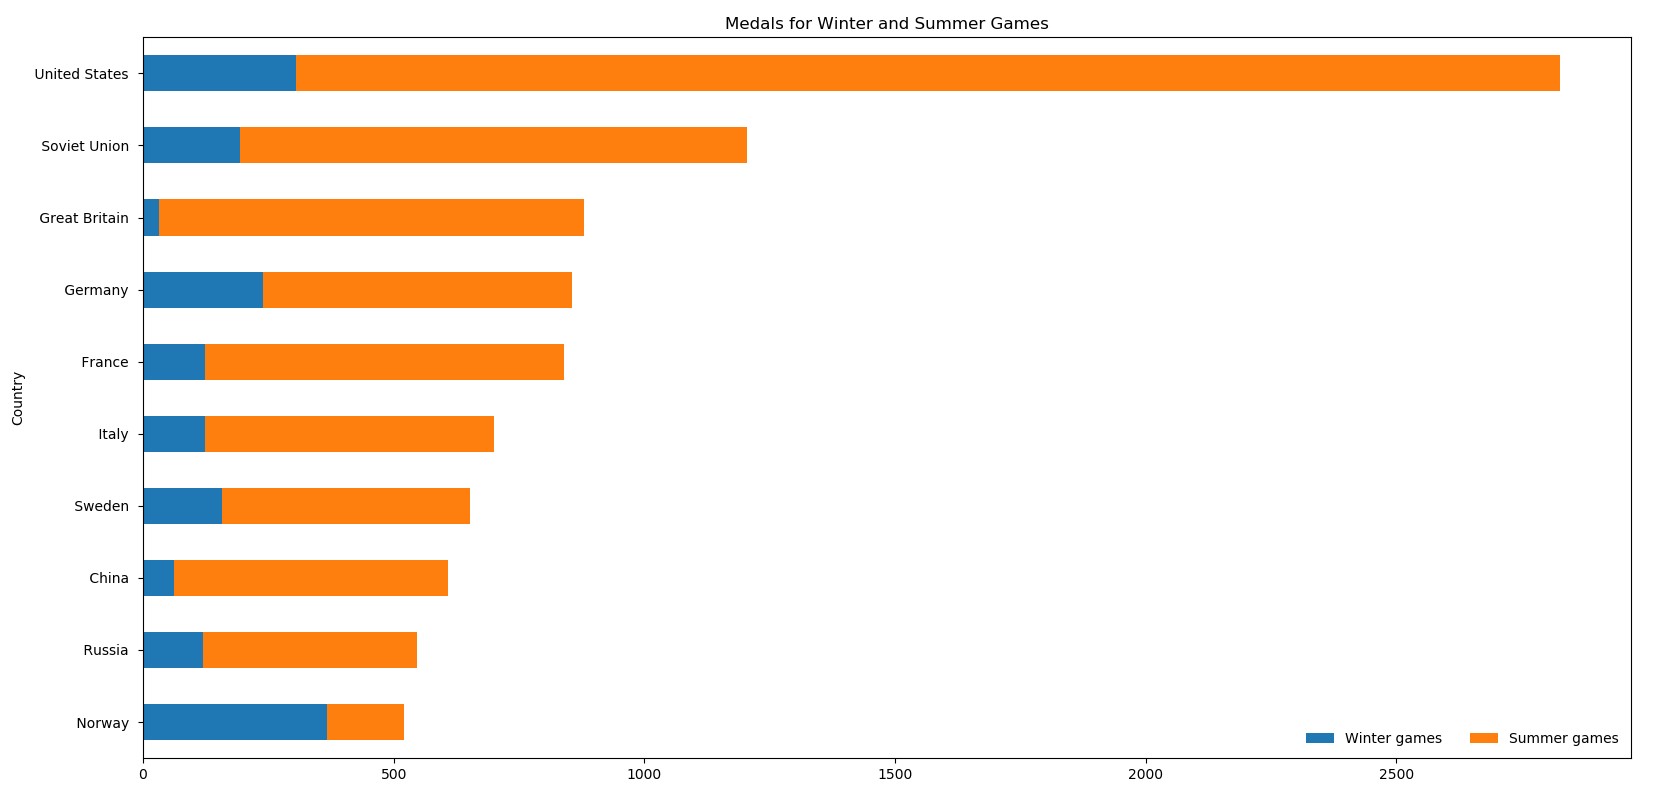
Plot a bar chart of the top 10 countries ordered by the number of total of medals (summer and winter). For each country use a stacked bar chart showing for each county the total medals for winter and summer games.
Question 8 : (based on the dataframe created in Question-3)
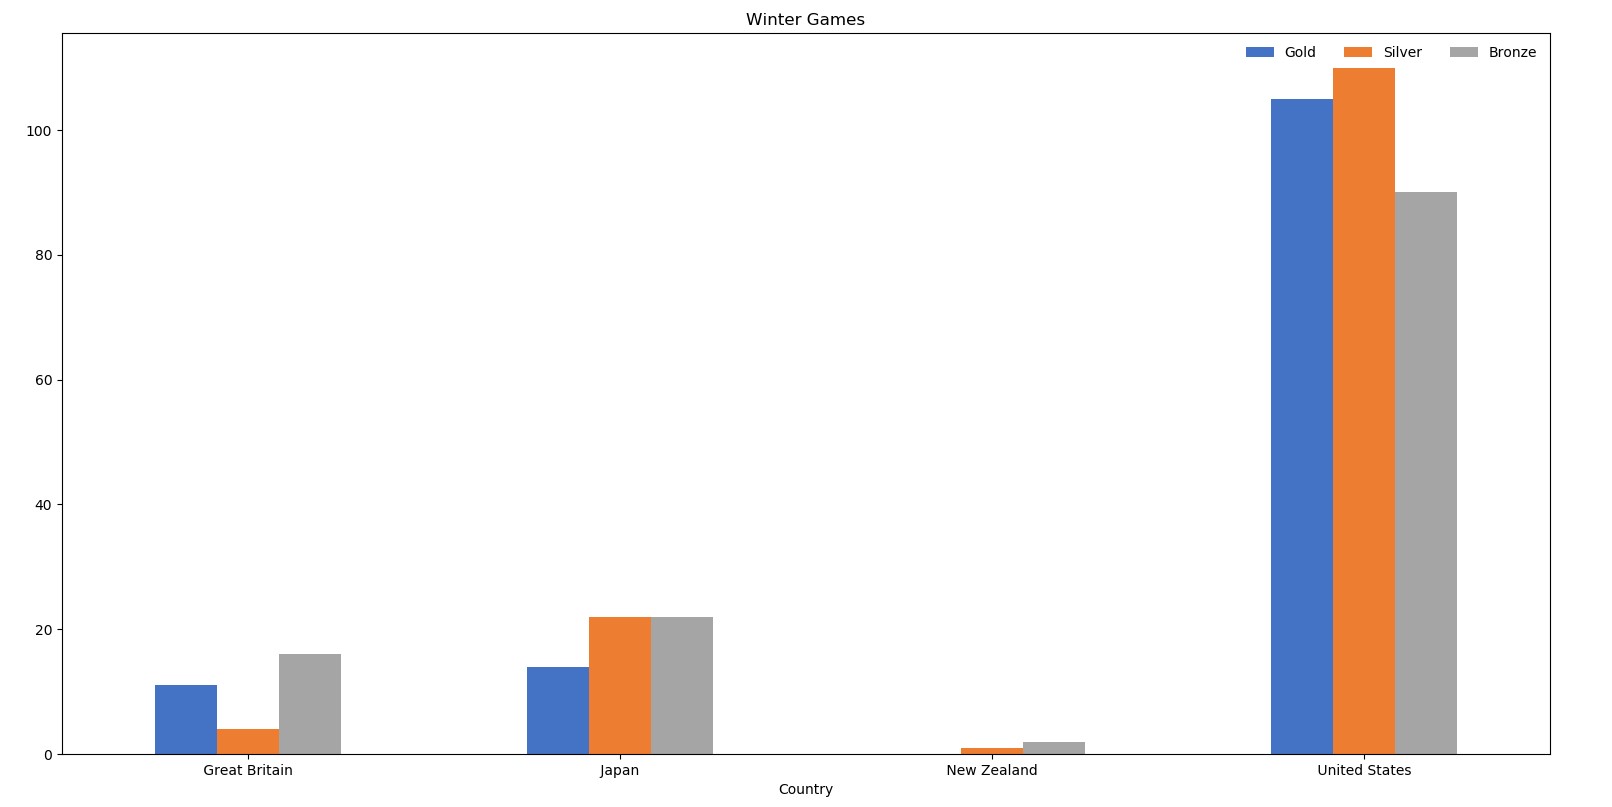
Plot a bar chart of the countries (United States, Australia, Great Britain, Japan, New Zealand). For each county you need to show the gold, silver and bronze medals for winter games.
Question 9: (based on the dataframe created in Question-3)
Assume that there countries are ranked based on a new ranking scheme for the summer games. In the new ranking scheme, a Gold, Silver, and Bronze medals have 5, 3, and 1 points respectively. And countries are ranked based on the points eared per participation (total points divided by total number of participations in games). Based on this scheme, rank the countries and print the name of top 5 countries having the best rate (points per participation ). Print both country names and rates.
Example: Imagine that a country has 1 gold medal, and 1 silver (5 + 3 points = totally 8 points); and this country had 10 participation in the summer games. The rate of points per participation will be 8 / 10 = 0.8 for this country. (if per participation is 0, the rate should be 0; )
--------------- question_9 ---------------
Country
 Unified Team      368.000000
 Soviet Union      358.666667
 United States     303.703704
 East Germany      255.800000
 Russia            211.666667
Question 10: (based on the dataframe created in Question-3)
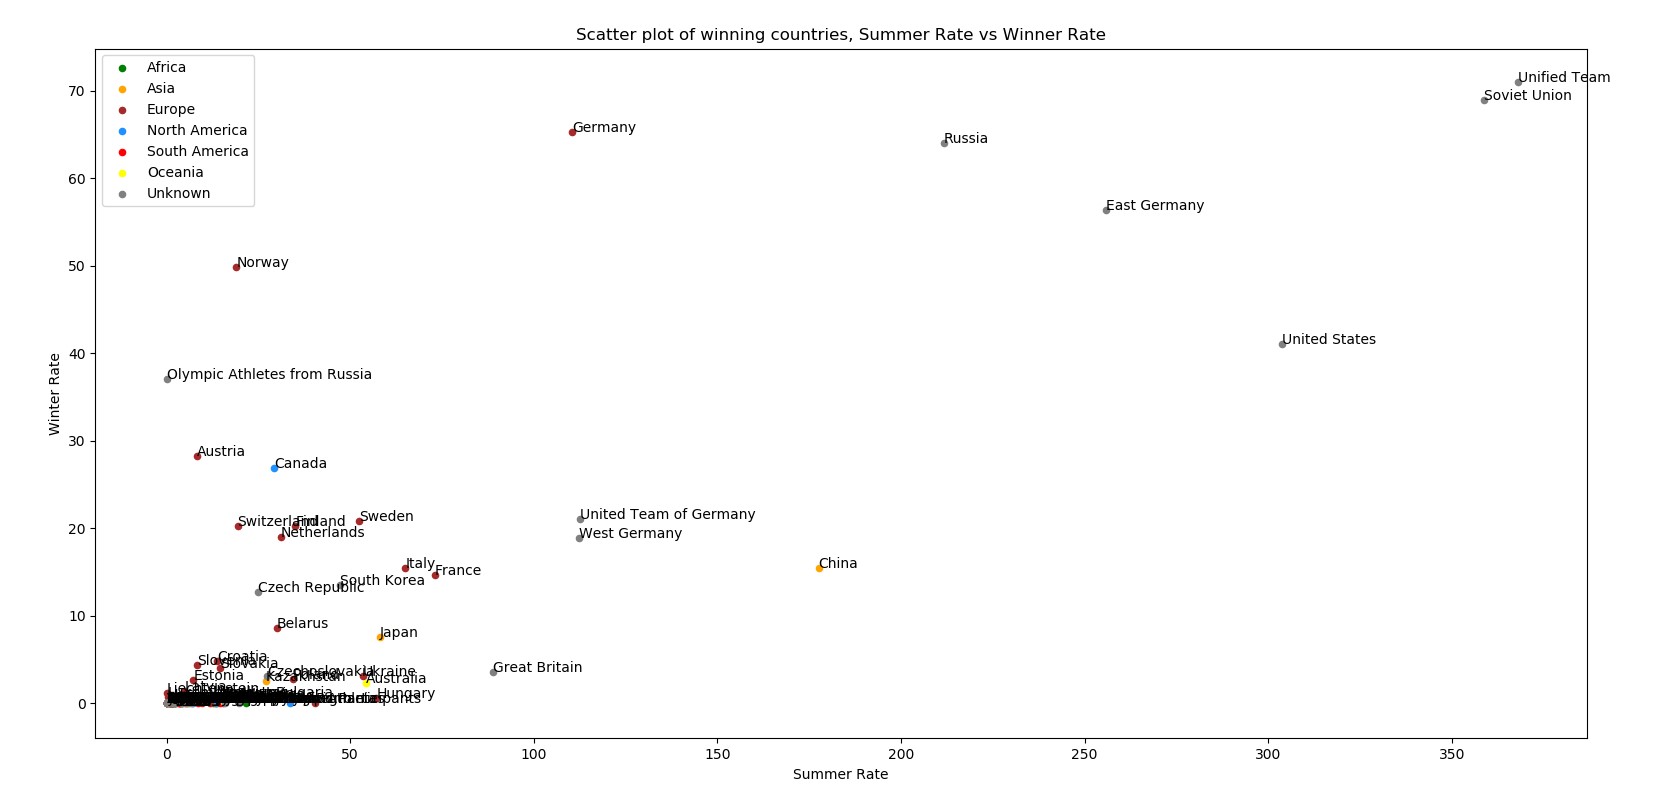
Based on the raking scheme in Question 9, also calculate the points per participation for each country in the Winter Games. Next plot a scatter chart with x = “points per participation for summer games” , and y = “points per participation for winter games”.
however, you also need to ink bubbles based on the their continents (e.g, Asia red, Africa blue, ..). You may use the Country-Continent dataset to colour the counties, and use a default color (Gray) for countries which are not listed in the dataset. You chart must also have legends and labels showing the name of countries beside the points inside the chart.